Data Table
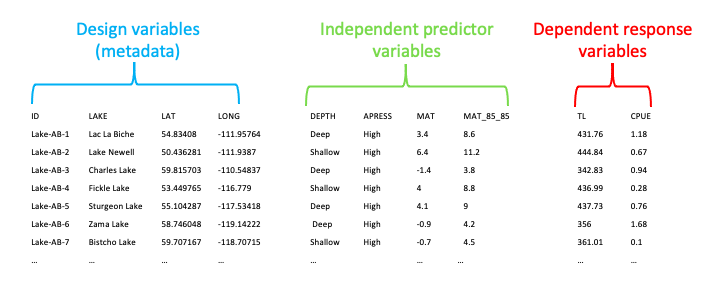
Table 1. Data table created for assessing the influence of climate change and angling pressure on the fitness and abundance of walleye in Canada. Table includes the first 7 rows of data out of 100, design variables, independent predictor variables, and dependent response variables.
|
We used 100 lakes in Canada as our sampling units (Fig. 1). Our design variables included ID, LAKE, LAT (latitude), and LONG (longitude; Table 1). Categorical independent predictor variables included APRESS (angling pressure; Table 1) and DEPTH (Table 1). Continuous predictor variables included MAT (°C) and MAT_85_85 (˚C; predicted MAT for the year 2085 under a 8.5 ˚C warming scenario; Table 1). Our continuous dependent response variables were TL (mean total length in mm; Table 1) and CPUE (catch per unit effort in fish caught day-1; Table 1). Both TL and CPUE are ‘observed’ values derived from sampling efforts. We also created histograms of continuous response variables for CPUE (Fig 3) and mean total length (Fig 4). A correlation plot of continuous predictor variables and continuous response variables is illustrated in Figure 5.
Exploratory Graphics

Figure 3 Histogram of the continuous response variable catch per unit effort (CPUE; fish day-1)
|

Figure 4 Histogram of the continuous response variable mean total fish length (TL; mm).
|

Figure 5 Correlation plot of continuous predictor variables and continuous response variables used for analyses. Histograms for each variable are plotted from top left to bottom right diagonally and include trend lines. The bottom left group of panels are scatter plots depicting the relationship between each variable. The top right group of panels are coefficients of determination (R2) for the relationship between each variable. The size of the number indicates the strength of the relationship, and P-values are indicated by stars (“***” = 0, “**” = 0.001, “*” = 0.01, “.” = 0.05,” “ = 0.1).
